Wullie Davidson: Climate Change Blog – Global Warming Just Got Worse

July, 2023
Warmest June, globally, since records began in 1860

20200324_Global_average_temperature_-_NASA-GISS_HadCrut_NOAA_Japan_BerkeleyE.svg.RCraig09, CC BY-SA 4.0 , via Wikimedia Common
Mid 2023 seems destined to go into the record books as the period when global warming lurched forward into a higher gear. Global atmospheric and sea surface temperature (SST) records for the date climbed to record breaking levels, atmospheric temperature records beginning in late May and continuing to rise until well into July. New global SST records were set in March, and continue at record highs for the date. Globally, June was the warmest June in a dataset going back to 1860, beating the previous record set in 2019 by 0.15 C. An all time daily global average temperature record was set on July 3, only to be broken again, the next day, by an incredible 0.17C. If that doesn’t seem much, just bear in mind that it’s the average increase for every square metre of the globe. The record was equalled the next day, then broken again, the following day. These may have been the warmest days that the Earth has experienced since before the last Ice Age, more than 100,000 years ago. Since Earth’s temperature usually peaks in late July or early August, there’s every possibility that we will continue to see records being broken for the hottest day ever. The UK Met Office confirmed that the UK had its hottest June on record, beating the previous record, set jointly in 1940 and 1976, by an incredible 0.9 C. “If, a few decades ago, people may have thought climate change was a relatively slow moving phenomenon, we are now witnessing our climate changing at a terrifying rate”, said Professor Peter Stott, who leads the UK Met Office’s Climate Monitoring and Attribution team.
Global sea surface temperatures (SSTs)
![SST_20131220_blended_Global NASA Official website, [1]., Public domain, via Wikimedia Commons](https://www.glasgowwestend.co.uk/wp-content/uploads/2023/07/SST_20131220_blended_Global-NASA-Official-website-1.-Public-domain-via-Wikimedia-Commons.png)
SST_20131220_blended_Global NASA Official website, [1]., Public domain, via Wikimedia Commons
Tropical cyclone records

Hurricane_Kate_(2003)-_Good_pic √
Officially, the Atlantic hurricane season begins on June 1 and ends on November 30. The ocean warms up much more slowly than air, and maximum SSTs are seen in September. Hurricanes can form in or north of the Caribbean, in the Gulf of Mexico, or in a large swathe of the Atlantic, known as the Main Development Region (MDR), which lies between the Caribbean and the coast of Africa. The strongest storms usually form in the MDR in late August or September, because that’s when SSTs are at their highest, and the storms have a large area of warm water to energise them, and no land areas to hinder development. Suppressing wind shear also tends to be weaker at this time. In more than a century of record keeping, only a handful of named storms have formed in the MDR in June, but this year an unprecedented TWO storms formed, Bret and Cindy. Bret reached 70 mph, 4 mph below the threshold for a category 1 hurricane, while Cindy was a 60 mph storm. This was due to the anomalously warm SSTs in the region.
On May 14, cyclone Mocha tied with cyclone Fani (2019) as the strongest tropical cyclone ever recorded in the northern Indian Ocean, with category 5 winds of 175 mph. The third strongest was cyclone Amphan (165 mph) in 2020. The three strongest cyclones on record all occurring in the space of just 4 years is strong evidence that rising ocean temperatures as a result of global warming will result in stronger cyclones/hurricanes. This does not bode well for this year’s Atlantic hurricane season, given the current very high SSTs which will increase further well into September. However, we are now in an El Nino year, and El Ninos are known to suppress hurricane formation by increasing wind shear in the Atlantic. So, it’s a wait and see situation. I tend towards the view that the record high SSTs will dominate over increased wind shear.
El Nino
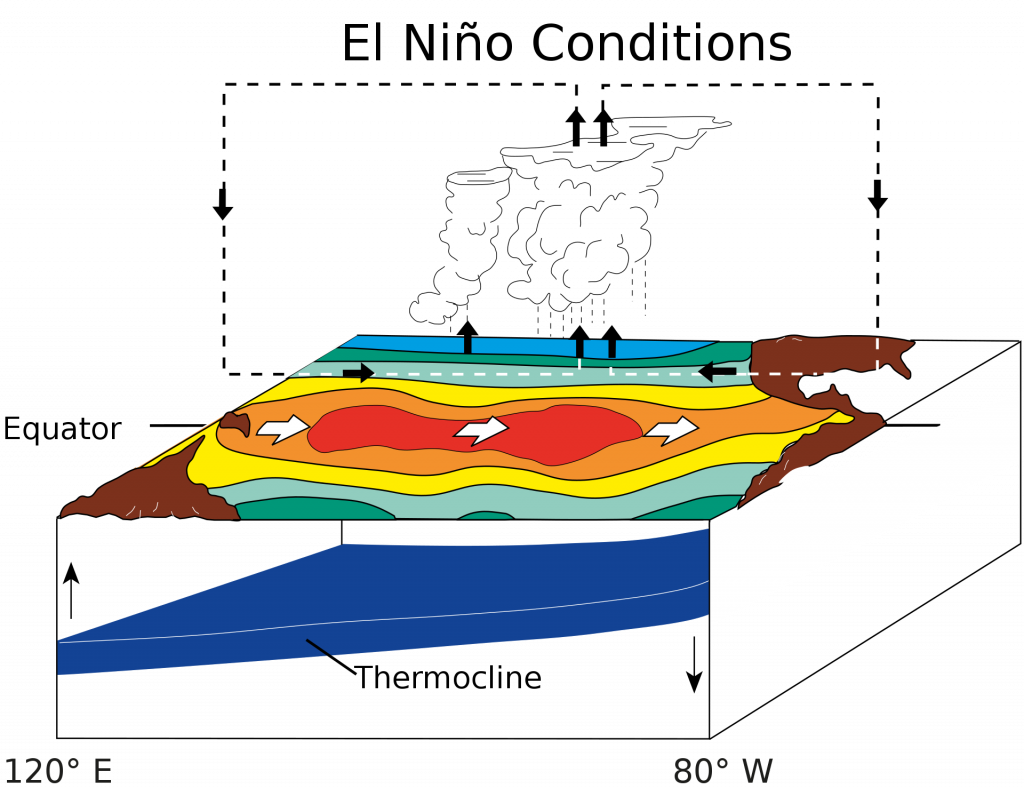
El Nino
The 3 year La Nina event in the tropical Pacific has ended, and El Nino conditions now prevail. El Ninos are designated as weak, moderate, strong or very strong. A weak El Nino is declared when temperatures in the mid tropical Pacific consistently exceed 0.5 C above normal. Moderate is >1 C, strong >1.5 C, and very strong >2 C. The last El Nino in 2018-19 was weak and the previous one in 2015-16 was very strong. El Ninos boost global temperatures, particularly in the second year, and the 2015-16 event resulted in the global temperature record being broken by a considerable margin in both years. The current El Nino is hovering around the +1 C mark, and is expected to strengthen. Given everything else that’s going on in the world right now, it’s very likely that 2023 will set a new global temperature record, and this will be broken again in 2024.
Canada wildfires

canada wildfires NASA, NASA Earth Observatory image by Wanmei Liang, using MODIS data from NASA EOSDIS LANCE and GIBS:Worldview., Public domain, via Wikimedia Commons
Beginning abnormally early in March, Canada has experienced the worst wildfire event, in terms of its extent and duration, in North American history, and this is ongoing. As of July 9, 3,831 wildfires had burned over 36,000 square miles, and there were 815 fires still active, 495 of which were described as ‘out of control’. The Canadian minister of Public Safety stated “These conditions, this early in the season, are unprecedented. Due to climate change, similar events may continue to increase in both frequency and severity across our country.” So far, around 156,000 people have been evacuated.
By June 7, 128 million people in the US were under air quality alerts, and both New York City and Chicago became the worst polluted cities in the world. NYC and many other cities were shrouded in an apocalyptic orange haze and flights to NYC were halted. The smoke spread to Europe, but as it was in the upper atmosphere, it did not cause any pollution issues. In some places, it caused spectacular sunrises and sunsets. Roughly half of all wildfires in Canada are believed to be caused by lightning, and lightning is becoming more frequent in a warming world.
Record low Antarctic sea ice extent
After reaching a record low summer minimum extent, earlier this year, Antarctic sea ice has continued to break records during its winter regrowth. At the end of June, it covered 4.5 million square miles, a million square miles less than the average for 1981-2010, and almost half a million square miles below the previous record low for the end of June, set in 2022.
‘Weather whiplash’
Weather whiplash is the phenomenon of rapid swings between extremes of weather. The phrase started to appear in meteorological literature about 10 years ago. It can be seen in both short term and long term weather trends. Perhaps the most obvious example of short term weather whiplash is when heat waves and drought lasting a few days or weeks end with thunderstorms and torrential rain. Increasingly, the term is being used by climate scientists to explain the accelerating trend of extremes of weather in the same region, over months and years, which they believe is being caused by climate change.
In recent years, the southwestern region of the US, particularly California, has experienced a ‘megadrought’ that began in 2000. This drought was preceded by by the wettest period in at least 1,200 years. From 2012 to 2015, California experienced drought that was unprecedented in the instrumental record, going back to 1896. Palaeoclimatic records indicate that it was the driest period since the late 16th century.
In November 2022, a parade of ‘atmospheric rivers’ from the Pacific began, which brought welcome relief from the drought. This caused extensive flooding, but also replenished reservoirs, and increased the Sierra Nevada snowpack to almost 300% of normal in places. The water that melting snow contributes to river levels in summer is crucial for the irrigation of agriculture in the region. This stream of moisture from the Pacific was the most extreme since 1969.

Flooding Italy
In mid May, severe and prolonged drought in northern Italy was followed by the worst flooding in the country for over 100 years. 23 rivers burst their banks, and there were 280 landslides, engulfing 41 cities and towns. Half the annual rainfall fell in just 36 hours. The drought parched ground was unable to absorb the water, so a larger amount than normal simply ran off the surface, into swollen rivers. This is a very important detail. When weather switches between extreme drought and extreme rainfall, much less of the rain that falls actually irrigates the soil, because the soil becomes dry and impermeable. So, although there will be more rainfall in a warmer world, due to increased evaporation, less of it will irrigate land, and a greater proportion of it will just run off back to the sea. There will therefore be more droughts and floods in a warmer world, but because less of the increased rainfall will irrigate soil, drought is likely to be the prevailing regime. In the Horn of Africa (Somalia, Kenya and Ethiopia), a three year long drought was broken in the spring of 2023 by extreme rainfall and flooding, which forced 220,000 people from their homes in Somalia alone. The UN has stated that the region will continue to experience protracted drought, and that the destructive rains that punctuate this will not compensate for the water deficit.
Although ‘weather whiplash’ is more commonly used to describe dramatic changes from intense heat and drought, followed by extreme rainfall, it’s also used for extreme temperature changes. December 2022 and January 2023 brought winter weather whiplash to the central and eastern US. Many areas saw temperature swings of up to 40 C between the most intense day of the cold spell on December 23 and the anomalous warmth of December 30. Such extreme temperature fluctuations are becoming more common due to changes in the jet stream caused by Arctic warming.
Wullie Davidson, July, 2023
This section: COP26 Glasgow, Climate Change, Save the Planet, Science, Biodiversity Events, Science: Climate Change and Other Topics
Filed under: COP26 Glasgow, Climate Change, Save the Planet, Science, Biodiversity Events, Science: Climate Change and Other Topics
Prevous page or post | Next page or post
Written by : Pat Byrne
Publisher of Pat's Guide to Glasgow West End; the community guide to the West End of Glasgow. Fiction and non-fiction writer.
Related Pages
- W. Davidson Climate Change Blog: Super El Nino on the Way?
- Glasgow Seed Library – Pollination: Seed to Seed Workshop
- A Monster Called Milton
- Tree Identification, Training and Guides Glasgow
- Wullie Davidson: Record Global Temperature in 2023
- Global Climate Change in September and October 2023
- Wullie Davidson: June until August, 2023 – Climate Events
- Glasgow National Park City Event
- Wullie Davidson: Climate Change Blog – Global Warming Just Got Worse
- How To Save Our Planet – The Children’s Wood
- World Environment Day 2023 – Partick
- SCCAN: The Oil Machine – can we be break the addiction
- Wullie Davidson Climate Change Blog: Global Ocean Temperature Reaches Record High – El Nino Brewing Up
- SCCAN. Member Networking Meeting: Community Food
- Sharing City Community Assembly
- Wullie Davidson on Climate Change – European Winter Drought and More
- Wullie Davidson: Extreme Weather Events of 2022
- Wullie Davidson’s Blog: Avian Influenza
- Climate Crisis Protest in Lützerath
- Interfaith Glasgow: Climate Justice is Gender Justice